
More Information
Submitted: October 20, 2020 | Approved: December 06, 2021 | Published: December 07, 2021
How to cite this article: Abdollahpour S, Miri HH, Khadivzadeh T. Prediction of neonatal and maternal index based on development and population indicators: a global ecological study. Clin J Obstet Gynecol. 2021; 4: 101-105.
DOI: 10.29328/journal.cjog.1001096
Copyright License: © 2021 Abdollahpour S, et al. This is an open access article distributed under the Creative Commons Attribution License, which permits unrestricted use, distribution, and reproduction in any medium, provided the original work is properly cited.
Keywords: Ecologic study; Maternal mortality; Neonatal mortality; Under 5 mortality; Gender gap index

Prediction of neonatal and maternal index based on development and population indicators: a global ecological study
Sedigheh Abdollahpour1 , Hamid Heidarian Miri2 and Talat Khadivzadeh3*
1PhD Student Research Committee, Department of Midwifery, School of Nursing and Midwifery, Mashhad University of Medical Sciences, Mashhad, IR Iran
2PhD, Social Determinants of Health Research Center, Mashhad University of Medical Sciences, Mashhad, Iran
3Associate Professor, Reproductive Health, Nursing and Midwifery Care Research Center, Mashhad University of Medical Sciences, Mashhad, Iran
*Address for Correspondence: Talat Khadivzadeh, Associate Professor, Reproductive Health, Nursing and Midwifery Care Research Center, Mashhad University of Medical Sciences, Mashhad, Iran, Email: [email protected]
Introduction: Although worldwide maternal and neonatal mortalities have decreased, but Achieving sustainable development goals remains an unfinished agenda and global challenge. This study aimed to predict neonatal and maternal index based on development and demographic indicators.
Methods: In this ecologic study, the dependent variables were Maternal mortality ratio (MMR), Neonatal mortality rate (NMR), and Under 5 Mortality Rate (U5MR) and the independent variables were Gender gap index (GGI) and its four components, human development, life expectancy, total fertility rate, and population growth. Data conducted using international secondary data published data bases of health metrics from 2016 to 2018 in 149 countries from WHO (World Health Organization), World Economic Forum, UNICEF (United Nations Children's Fund), and UNDP (United Nations Development Programme). Data analysis was performed using correlation model in Stata version 14.1 software.
Results: In this study, economic participation and total fertility rate are positively and educational attainment, Human Capital Index and life expectancy are negatively associated with MMR. Human Capital Index, Educational attainment, and Life expectancy are negatively associated with NMR. Economic participation and total fertility rate are positively and educational attainment, Human Capital Index and life expectancy are negatively associated with U5MR.
Conclusion: To reduce the maternal and neonatal mortality rate, it is important to pay attention to indirect causes such as equal conditions for men and women to demographic and population indices such as economic participation, educational attainment, Human Capital Index and life expectancy
After 2015 target date for the Millennium Development Goals (MDGs), maternal and neonatal mortality is yet one of the world’s most critical challenges despite significant progress over the past decade [1-3]. Although maternal deaths worldwide have decreased by 45% since 1990, 800 women still die each day from largely preventable causes before, during, and after the time of giving birth [1,2].
The Sustainable Development Goals (SDGs) where the target is to end preventable of maternal mortality, newborns and children under 5 years of age and strategies are grounded in a human rights approach to maternal and newborn health, and focus on eliminating significant inequities that lead to disparities in access, quality and outcomes of care within and between countries [3,4]. It is also clear that maternal deaths merely are the tip of the iceberg of maternal disability. For every woman who dies, many more will survive but often suffer from lifelong disabilities [5]. Based on WHO approach, the worldwide prevalence of organ failure, are 18.67/1000 live birth [6].
MDG 5a calls for a 75% decrease in maternal mortality ratio (MMR) from 1990 to 2015. By 2013, a 45% reduction was achieved (from 380 deaths/100 000 live births in 1990 to 210 deaths/100 000 live births), showing significant progress but still falling far short of the global goal [7,8]. By 2030, all countries should reduce MMR by at least two thirds of their 2010 baseline level. The average global target is an MMR of less than 70/100 000 live births by 2030. The supplementary national target is that no country should have an MMR greater than 140/100 000 live births by 2030 [9]. The first 28 days of life – the neonatal period – represent the most vulnerable time for a child’s survival. In 2016, 2.6 million deaths, or roughly 46% of all under-five deaths, occur during this period [3]. Some 5.3 million children under age five died in 2018 [10].
The risk of a child dying before completing the first year of age was highest in the WHO African Region (51 per 1000 live births), over six times higher than that in the WHO European Region (8 per 1000 live births) [1]. Given the statistics above that indicate the current situation, the “obstetric transition” concept was adapted from classic models of epidemiologic transitions experienced as countries progress along a trajectory towards development. Applied to maternal and newborn health care, countries pass through a series of stages that reflect health system status and the shift in primary causes of death as reductions in the rate of maternal mortality are achieved and the causes of death shift from direct causes and communicable diseases to a greater proportion of deaths from indirect causes [11]. Many studies assessed determinants of maternal mortality in developing [12,13] countries with few cases of maternal death on a smaller number of countries have been conducted, without acknowledging the impact of broader health and social indicators like demographic indicators. In practice, although neonatal and maternal mortality remains a global challenge, most studies have emphasized the direct causes of maternal mortality [14] and have not addressed demographic indicators approach. Therefore, this study aimed to predict neonatal and maternal index based on development and demographic indicators.
This ecological study was conducted using international secondary data published by data base of health metrics from 2016 to 2018 from WHO (World Health Organization), World Economic Forum, UNICEF (United Nations Children's Fund), and UNDP (United Nations Development Programme) data bases to identify correlates of neonatal and maternal health indexes in 149 countries from all over the world. Each country is considered as a unit of analysis. To achieve the information of every country, every single variable examined in the study should be extracted. For statistical analysis a linear regression model was fitted for each dependent variable of the study. In this study the dependent variables were MMR, NMR, and U5MR and the independent variables were Gender gap index (GGI), economic participation, educational attainment, health, political empowerment, human development, life expectancy, total fertility rate, and population growth (Table 1) which were as follows:
| Table 1: Description of the included variables. | |||||
| Variable | Number | Mean | Std. Dev. | Min | Max |
| MMR | 147 | 149.47 | 228.34 | 3.00 | 1360 |
| NMR | 148 | 14.24 | 15.21 | 1.10 | 91.80 |
| U5MR | 148 | 26.39 | 28.29 | 2.10 | 127.30 |
| Economic participation | 149 | 0.65 | 0.13 | 0.26 | 0.92 |
| Educational attainment | 149 | 0.96 | 0.08 | 0.58 | 1.00 |
| Health | 149 | 0.97 | 0.01 | 0.92 | 0.98 |
| Political empowerment | 149 | 0.20 | 0.14 | 0.01 | 0.67 |
| Human Capital Index | 120 | 61.82 | 8.73 | 35.84 | 77.12 |
| Life expectancy | 147 | 74.75 | 7.65 | 53.00 | 85.00 |
| Total fertility rate | 147 | 2.59 | 1.25 | 1.20 | 6.00 |
| Population growth | 149 | 1.25 | 1.13 | -1.26 | 4.38 |
- Gender gap index (GGI) is an index designed for measuring gender equality, first calculated by the world economic Association in 2006 which are important in terms of economy are ranked. The gender equality index and its four component (economic opportunities and participation, educational attainment, survival and health, and eventually political empowerment) range between 0 and 1. The closer this value to 1, the greater the gender equality score will be, suggesting that the gender gap between men and women is low in this country [15]. The score of this index was generally extracted alongside its four component using the report published by the world economics Association in 2018 in 149 countries [15].
- Population growth rate reflects the number of births and deaths during a period and the number of people migrating to and from a country [16].
- Total fertility rate reflects the number of children who would be born per woman (or per 1,000 women) if she/they were to pass through the childbearing years bearing children according to a current schedule of age-specific fertility rates [17].
- Life expectancy for women is a statistical measure of the average time an organism is expected to live, based on the year of its birth, its current age and other demographic factors including gender and the most commonly used measure is life expectancy at birth [17].
- Human Capital Index score can roughly be interpreted as a percentage measure of the degree to which a country is successful in developing and deploying the full range of its people’s human capital potential [15].
- Maternal mortality rate (MMR) states the rate of mothers deceased in response to complications associated with pregnancy and delivery per 100,000 live births. These statistics in the present study were taken from the statistics published by UNFPA in 2017 [17].
- Neonatal mortality rate (NMR) refers to the rate of mortality of neonates younger than 28 days per every 1000 live births. In the present study, these statistics were taken from the reports offered by UNICEF in 2017 [18].
- The Under 5 mortality rate (U5MR) is defined as the mortality of children younger than five years old per every 1000 live births. Similarly, its statistics were taken from a report published by UNICEF in 2017 [18].
After each of the above listed data were extracted separately from different sources by country, each variable was checked for completeness and consistency and then it was statistical analyzed using Stata version 14.1 software. The aim of the models was prediction of the outcome rather than estimating the measure of association or effect. So, to fit the simplest model with highest ability of prediction performs a backward-selection estimation was performed using Stata command “stepwise, PR (0.1): regress dependent variable independent variables”. In this procedure a variable was removed from the model if its p - value was less than 0.1. The value of 0.1 was chosen to make the model as simple as possible. The emphasis on simplicity of the models was to enable the researchers to predict the outcomes with as few variables as possible as the independent variables were in the level of the country and may be difficult to attain. Dependent variables were in the scale of 1000 to avoid having to deal with coefficients with many decimals. This transformation should be regarded in the interpretation of coefficients. For example, in Table 2, the coefficient for life expectancy is interpreted as one unit increase in life expectancy is associated with 8.68 unit, on average, decrease in MMR. If MMR regarded in the scale of one, we would say that one unit increase in life expectancy is associated with 0.00868, on average, decrease in MMR. Interpretation of the coefficients for the independent variables that are in the scale of one, for example economic participation in Table 1, would be that one unit increase in economic participation is associated with 241.86, on average, increase in MMR or equivalently 0.001 increase in economic participation is associated with 0.24186, on average, increase in MMR.
| Table 2: Association of MMR with independent variables using linear regression model. | ||||
| Variable | Coefficient regression | 95% CI | p - value | Adjusted R2 |
| Economic participation | 241.86 | (120.99, 362.73) | 0.000 | 0.885 |
| Educational attainment | -699.78 | (-982.02, -417.54) | 0.000 | |
| Total fertility rate | 59.95 | (36.35, 83.56) | 0.008 | |
| Life expectancy | -8.68 | (-12.16, -5.2) | 0.000 | |
| Human Capital Index | -3.24 | (-5.61, -0.87) | 0.008 | |
| Constant | 1353.48 | (969.62, 1737.33) | 0.000 | |
As indicated in Table 2, economic participation and total fertility rate are positively and educational attainment, Human Capital Index and life expectancy are negatively associated with MMR. The adjusted R2 shows that the fitted model can explain 88.5% of the total variation in MMR. In other words, the correlation coefficient of the predicted MMR with the observed MMR would be 0.94 that shows this model can acceptable predict MMR (Figure 1).
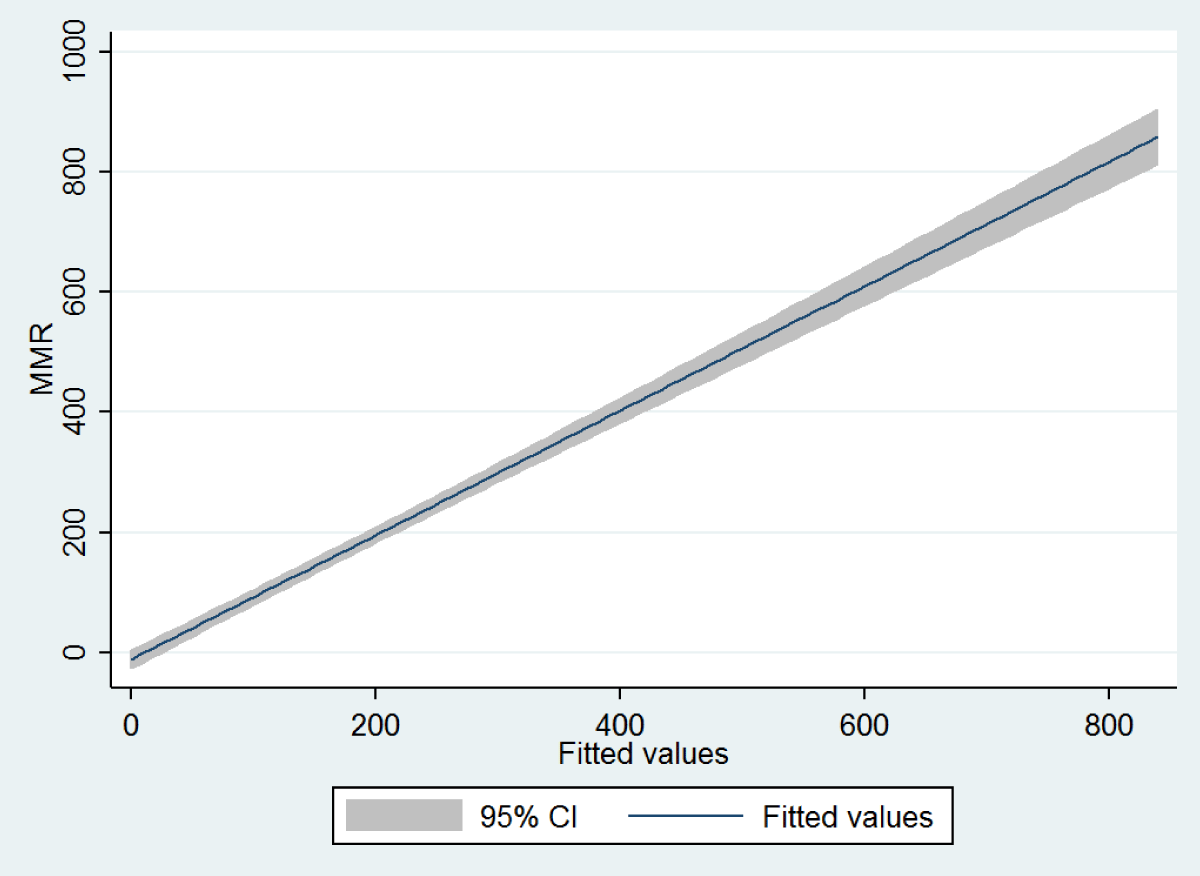
Figure 1: Fitted value of MMR against its observed value based on the model in Table 2.
Table 3 shows that Human Capital Index, Educational attainment, and Life expectancy are negatively associated with NMR. The adjusted R2 shows that 62.6% of the total variation in NMR could be explained by the model. In fact, the correlation coefficient of the predicted NMR with the observed NMR would be 0.71 that shows this model can be acceptable to predict NMR (Figure 2).
| Table 3: association of with independent variables using linear regression model. | ||||
| Variable | Regression coefficient | 95% CI | p - value | Adjusted R2 |
| Human Capital Index | -0.32 | (-0.60, -0.03) | 0.028 | 0.626 |
| Educational attainment | -54.40 | (-89.59, -19.22) | 0.003 | |
| Life expectancy | -0.94 | (-1.32, -0.56) | 0.000 | |
| Constant | 156.66 | (133.84, 179.48) | 0.000 | |
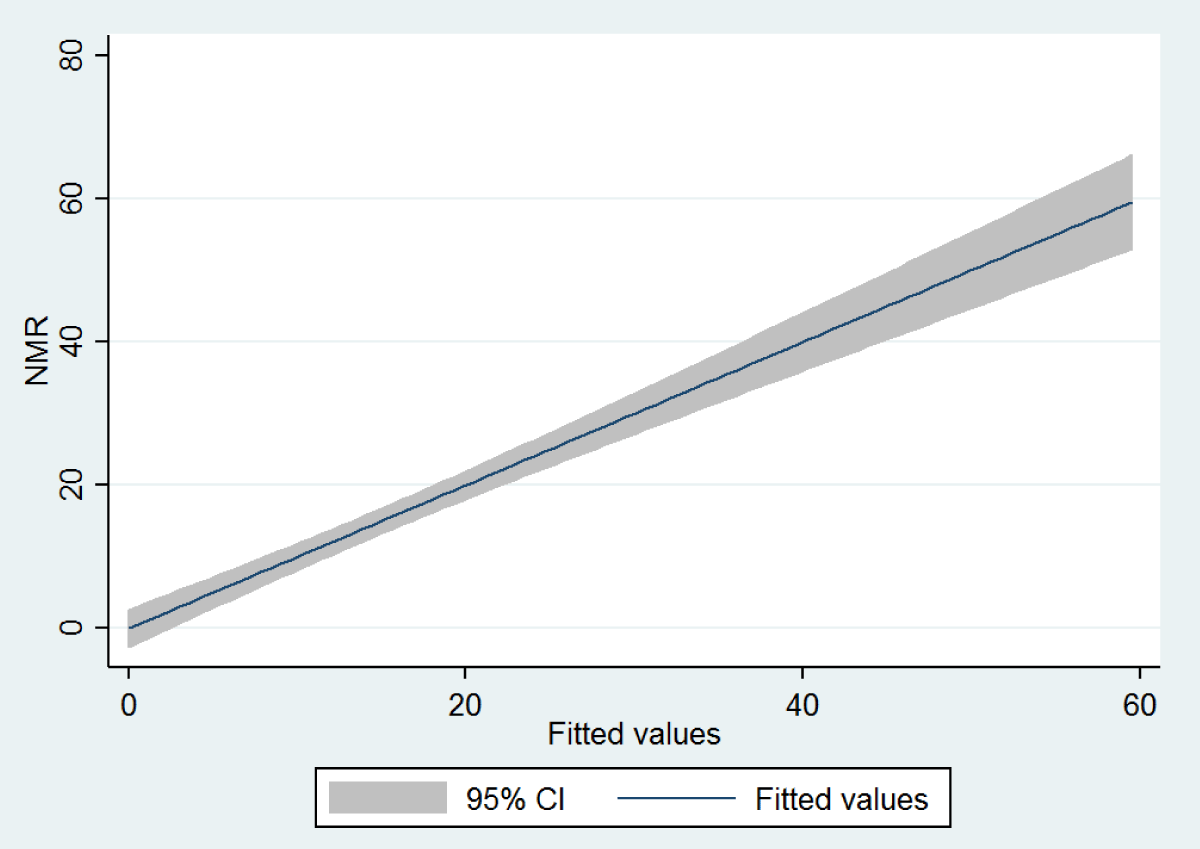
Figure 2: Fitted value of NMR against its observed value based on the model in Table 3.
In Table 4, it is shown that economic participation and total fertility rate are positively, and educational attainment, Human Capital Index and life expectancy are negatively associated with U5MR. However, the association of Economic participation was not statistically significant. The adjusted R2 shows that the fitted model can explain 92.2% of the total variation in U5MR. In other words, the correlation coefficient of the predicted U5MR with the observed MMR would be 0.96 that shows this model can acceptable predict U5MR (Figure 3). In this study, each of the dependent variables was evaluated with each of the independent variables such as total GGI, but the results show that only some components of GGI are related to MMR, NMR, and U5MR.
| Table 4: Association of under5MR with independent variables using linear regression model | ||||
| Variable | Regression coefficient | 95% CI | p - value | Adjusted R2 |
| Economic participation | 13.18 | (-0.37, 26.73) | 0.056 | 0.922 |
| Educational attainment | -107.43 | (-139.07, -75.79) | 0.000 | |
| Life expectancy | -1.92 | (-2.31, -1.53) | 0.000 | |
| Total fertility rate | 3.68 | (1.03, 6.32) | 0.007 | |
| Human Capital Index | -0.33 | (-0.59, -0.06) | 0.016 | |
| Constant | 275.47 | (232.44, 318.5) | 0.000 | |
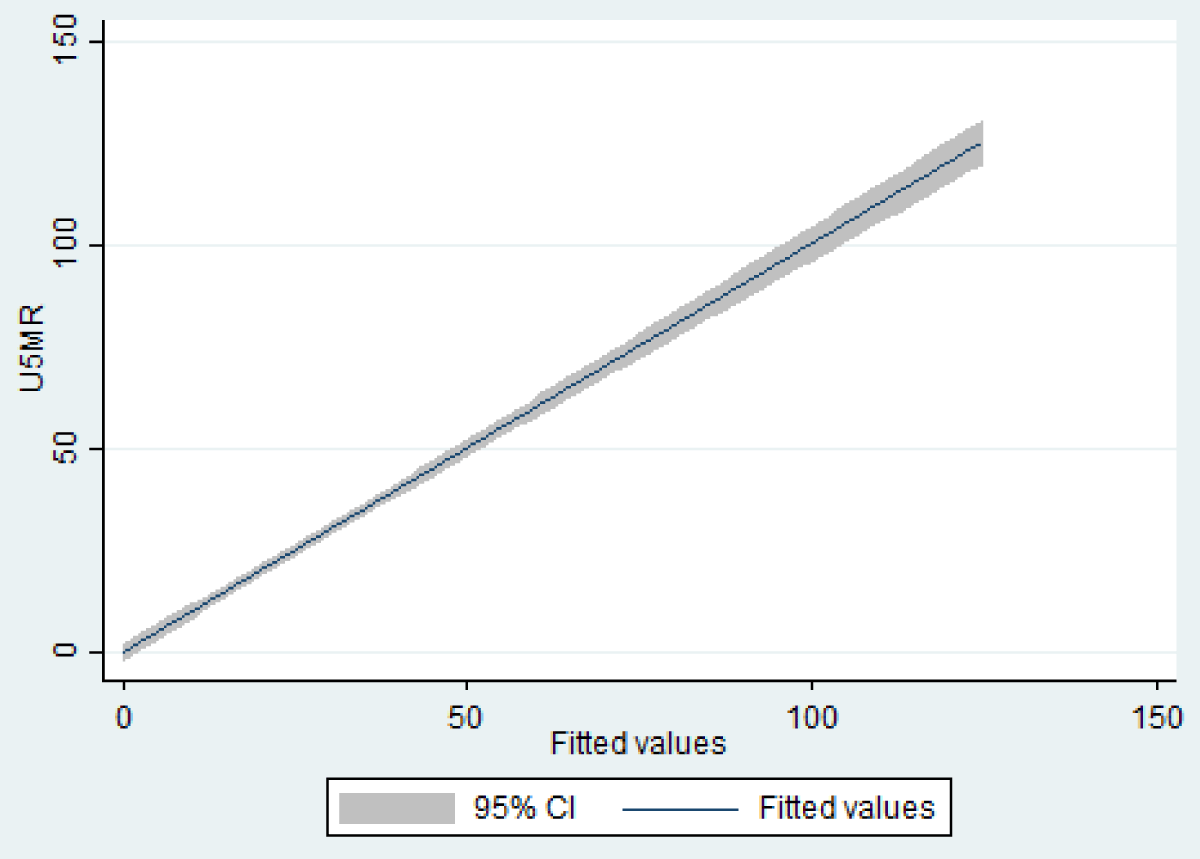
Figure 3: Fitted value of U5MR against its observed value based on the model in Table 4.
In this study, data from 188 countries were analyzed and findings revealed that indicators such as economic participation, total fertility rate, educational attainment, human Capital Index and life expectancy are important for predicting MMR across countries. Consistent with this result, the Tajik’s study in Iran showed that HDI has the highest inverse correlation with MMR (-0.77). A rise in HDI (which itself is a combination of life expectancy, level of education and income) was associated with a significant fall in MMR [19]. Also In Alvarez study that performed in Sub-Saharan Africa, there was an inverse and significant correlation of the maternal mortality ratio with macro-economic factor related to the educational and health care system-related factors education index [12]. Consistent with the results of the present study, Girum’s study in 82 developing countries showed that socio-economic indicators have significant correlation with MMR in developing countries [13,20].
In this study it is noted that total fertility rate has positive significant correlation with MMR which could be due to the fact that the risk of getting complication is proportional to the number of pregnancies a woman will have [13]. However, it is difficult to compare countries that have been successful in reducing maternal deaths with other countries that have failed, in sub-Saharan Africa, for every 160 women who die of pregnancy-related causes, only one in every 3,700 women die in the developed regions [2].
Another result of this study was the correlation between NMR and Human Capital Index, Educational attainment, and Life expectancy. Also economic participation, total fertility rate, educational attainment, Human Capital Index, life expectancy are associated with U5MR. In line with this result, Almasi-Hashiani in his study showed that most deaths in neonatal, infant, under 5 years old and mothers can be observed in countries with low HDI and there was a statistically significant correlation between these two factors [21,22]. It should be noted that the coefficients in this study shouldn’t have causal interpretation especially at the individual level as they are threatened by some phenomenon like ecological fallacy and confounding by differences in structural age among countries and other unmeasured or not included variables. This could be an explanation why some coefficients seem to be incoherent with the present knowledge. For example, according to results shown in Table 1, the more political participation of women corresponds to more MMR. However, this explanation is not testable at the moment and some other confounders could have incorporated in the present pattern of association between political participation and MMR. As explained in statistical analysis section the coefficients in this study should be used only for prediction of the outcomes including MMR, NMR, and U5MR.
Although ecological studies in this area are very limited, future research is more recommended than previously, because according to the WHO report on current trends, more than 60 countries will miss the SDG target of reducing neonatal mortality to at least as low as 12 deaths per 1000 live births by 2030. About half of them will not reach the target by 2050. These countries carry about 80 per cent of the burden of neonatal deaths in 2016 [3].
Strengths and limitations
One of the limitations of this study is the low number of ecological studies that have focused on maternal and neonatal health, so it would be difficult to compare the inconsistent results. One of the strengths of this study is that a large number of countries participated in the ecological study. This study is also one of the few studies that simultaneously examined three important maternal and neonatal health indicators.
Focusing on the direct causes of neonatal and maternal death is not enough to achieve the MDG and SGD goals. Rather, it is important to pay attention to the principles of human rights in reproductive health such as equal access for men and women to demographic and population indices such as economic participation, educational attainment, total fertility rate, Human Capital Index and life expectancy. Total fertility rate should be balanced. Macro-policymakers, with a broader and more comprehensive view of all the factors predicting maternal and child mortality, should announce the programs and countries are committed to implementing them.
Ethical statement
This study was funded by Mashhad University of Medical Sciences [grant number 970195].
The study was approved by the Ethics Committee of Mashhad University of Medical Sciences (IR.MUMS.NURSE.REC.1398.045).
Disclosure statement
No potential conflict of interest was reported by the authors.
- WHO. World Health Organozation. Global Health Observatory (GHO) data. Infant mortality. Situation and trends. 2017. https://www.who.int/gho/child_health/mortality/neonatal_infant_text/en/
- WHO. Maternal mortality fact sheet No. 348. Geneva: World Health Organization; 2014 (http://apps.who.int/iris/bitstream/10665/112318/1/WHO_RHR_14.06_eng.pdf?ua=1
- WHO. World Health Organozation. Global Health Observatory (GHO) data. Neonatal mortality. Situation and trends. 2016. https://www.who.int/gho/child_health/mortality/neonatal_text/en/
- WHO. Strategies towards ending preventable maternal mortality (EPMM), World Health Organization. 2015.
- WHO. Evaluating the quality of care for severe pregnancy complications: the WHO near-miss approach for maternal health. 2011.
- Abdollahpour S HMH, Khadivzadeh T. The global prevalence of maternal near miss: a systematic review and metaanalysis. Health Promot Perspect. 2019; 9: 255-262. PubMed: https://pubmed.ncbi.nlm.nih.gov/31777704/
- Hulton L, Murray S, Thomas D. The Evidence Towards MDG 5. London, England. 2010.
- Economic UNDo. The Millennium Development Goals Report 2008. United Nations Publications; 2008.
- Rath S, Patnala S, Bosman SJ. Sustainable Development Goals and Addressing Non-communicable Diseases. Indian J Pharm Pract. 2016; 9: 67.
- WHO. World Health Organozation. Global Health Observatory (GHO) data. Under-five mortality. Situation and trends. 2018. https://www.who.int/gho/child_health/mortality/mortality_under_five_text/en
- Souza JP, Tunçalp Ö, Vogel J, Bohren M, Widmer M, et al. Obstetric transition: the pathway towards ending preventable maternal deaths. BJOG. 2014; 121: 1-4. PubMed: https://pubmed.ncbi.nlm.nih.gov/24641529/
- Alvarez JL, Gil R, Hernández V, Gil A. Factors associated with maternal mortality in Sub-Saharan Africa: an ecological study. BMC Public Health. 2009; 9: 462. PubMed: https://pubmed.ncbi.nlm.nih.gov/20003411/
- Girum T, Wasie A. Correlates of maternal mortality in developing countries: an ecological study in 82 countries. Matern Health Neonatol Perinatol. 2017; 3: 19. PubMed: https://pubmed.ncbi.nlm.nih.gov/29142757/
- Say L, Chou D, Gemmill A, Tunçalp O, Moller AB, et al. Global causes of maternal death: a WHO systematic analysis. Lancet Glob Health. 2014; 2: e323-e333. PubMed: https://pubmed.ncbi.nlm.nih.gov/25103301/
- Forum WE. The Global Gender Gap Report 2018. https://www.weforum.org/reports/the-global-gender-gap-report-2018
- Nations U. Department of Economic and Social Affairs, Population Division, World Population Prospects: The 2017 Revision. 2017.
- UNFPA. Global data - Monitoring ICPD Goals: selected indicators. 2016. (https://www.unfpa.org/sites/default/files/SWOP-2016.xlsx)
- UNICEF. Child Mortality Estimates: Country-specific neonatal mortality rate. Estimates generated by the UN Inter-agency Group for Child Mortality Estimation (UN IGME) in 2017. http://data.unicef.org
- Tajik P, Nedjat S, Afshar NE, Changizi N, Yazdizadeh B, et al. Inequality in maternal mortality in Iran: an ecologic study. Int J Prev Med. 2012; 3: 116. PubMed: https://pubmed.ncbi.nlm.nih.gov/22347608/
- Kazemi Karyani A, Kazemi Z, Shaahmadi F. The main determinants of Under 5 Mortality Rate (U5MR) in OECD countries: A cross-sectional study. Int J Pediatr. 2015; 3: 421-427.
- Almasi-Hashiani A, Sepidarkish M, Vesali S. The correlation of human development index on fertility and mortality rate: a global ecological study. Int J Pediatr. 2016; 4: 4071-4080.
- Abdollahpour S, Heidarian Miri H, Khamse FK, Khadivzadeh T. The relationship between global gender equality with maternal and neonatal health indicators: an ecological study. J Matern Fetal Neonatal Med. 2020; 14: 1-7. PubMed: https://pubmed.ncbi.nlm.nih.gov/32290738/