
More Information
Submitted: June 07, 2021 | Approved: June 28, 2021 | Published: June 29, 2021
How to cite this article: Assefa EM, Janbo A, Ghiwot Y. Comparative analysis of cesarean section using the Robson's Ten-Group Classification System (RTCGS) in private and public hospitals, Addis Ababa, Ethiopia. Clin J Obstet Gynecol. 2021; 4: 081-091.
DOI: 10.29328/journal.cjog.1001093
Copyright License: © 2021 Assefa EM, et al. This is an open access article distributed under the Creative Commons Attribution License, which permits unrestricted use, distribution, and reproduction in any medium, provided the original work is properly cited.
Keywords: Addis Ababa; Cesarean section; Robson classification; Indications; Private; Public

Comparative analysis of cesarean section using the Robson's Ten-Group Classification System (RTCGS) in private and public hospitals, Addis Ababa, Ethiopia
Endalkachew Mekonnen Assefa1*, Adem Janbo2 and Yirgu Ghiwot1
1Department of Obstetrics and Gynecology, Addis Ababa University, College of Health Sciences, School of Medicine, Ethiopia
2Department of Obstetrics and Gynecology, Arsi University, College of Health Sciences, Ethiopia
*Address for Correspondence: Endalkachew Mekonnen Assefa, Department of Obstetrics and Gynecology, Addis Ababa University, College of Health Sciences, School of Medicine, Ethiopia, Email: [email protected]
Objectives: We analyzed the indications of cesarean section (CS) using Robson Ten-Group.
Classification Systems (RTGCS) and comparison between private and public health facilities in Addis Abeba hospitals, Ethiopia, 2017.
Methods: Facility-based retrospective cross-sectional study was carried out between January 1 and December 31, 2017, including 2411 mothers who delivered by CS were classified using the RTGCS. Data were entered into SPSS version 20 for cleaning and analyzing. Binary logistic regression and AOR with 95% CI were used to assess the determinants of the CS.
Results: The overall CS rate was 41% (34.8% and 66.8% in public & private respectively, p < .0001). The leading contributors for CS rate in the private were Robson groups 5,1,2,3 whereas in the public 5,1,3,2 on descending order. Robson group 1 (nulliparous, cephalic, term, spontaneous labor) and group 3 [Multiparous (excluding previous cesarean section), singleton, cephalic, ≥ 37 weeks’ gestation& spontaneous labor], the CS rate was over two-fold higher in the private than the public sector. Women in Robson groups 1, 2, 5 & 9 are two and more times higher for the absolute contribution of CS in private than public. The top medical indications of CS were non-reassuring fetal status (NRFS, 39.1%) and repeat CS for previous CS scars (39.4%) in public and private respectively. Mothers who delivered by CS in private with history of previous CS scar (AOR 2.9, 95% CI 1.4-6.2), clinical indications of maternal request (AOR 7.7, 95% CI 2.1-27.98) and pregnancy-induced hypertension (AOR 4.2, 95% CI 1.6-10.7), induced labor (AOR 2.5, 95% CI 1.4-4.6) and pre-labored (AOR 2.2, 95% CI 1.6-3.0) were more likely to undergo CS than in public hospital.
Conclusion: The prevalence of CS was found to be high, and was significantly higher in private hospitals than in a public hospital. Having CS scar [having previous CS scar, Robson group 5(Previous CS, singleton, cephalic, ≥ 37 weeks’ gestation) and an indication of repeat CS for previous CS scar] is the likely factor that increased the CS rate in private when compared within the public hospital.
Recommendation: It is important that efforts to reduce the overall CS rate should focus on reducing the primary CS, encouraging vaginal birth after CS (VBAC). Policies should be directed at the private sector where CS indication seems not to be driven by medical reasons solely.
Cesarean section (CS) is the delivery of the fetus, membrane, and placenta through the abdominal wall (laparotomy) and uterine (hysteretomy) incision after fetal viability [1,2], 28 weeks and above in Ethiopian context [3].
Globally, there is an alarming increase in CS rates for the past 24 years (6% in 1990 to 19% in 2014) though there are disparities among continents, countries (developed and developing), hospitals (private, government, teaching) [4-7]. However, in Sub-Saharan countries, there are minimum changes (from 2.3% to 3.5%) [8-10] and also the same in Ethiopia (0.7% in 1990% - 1.9% in 2016) [11,12] but some studies showed higher ranges(13). CS rate is an important indicator of access to essential obstetric care to prevent effectively maternal and perinatal morbidity and mortality when medically justified (9,14).
Cesarean section rates are extraordinarily high in private for-profit hospitals, and rates of 80% of all deliveries have been documented. The rise in the cesarean delivery rate has been higher in women delivering in private hospitals than in public hospitals. The finding from these studies indicates that differences in delivery management between public and private hospitals influence cesarean delivery rates [15-18).
In 2015, WHO has endorsed the Robson Ten-Group Classification System (RTGCS) as a global standard tool for assessing, monitoring and comparing CS rates across different health care settings to propose and potentially implement effective measures to reduce CS rates [19,20]. This system classifies women into one of ten categories that are mutually exclusive but totally inclusive that is based on five obstetric characteristics that are routinely collected in health facilities: 1) parity (nulliparous, multiparous with and without previous CS), 2) onset of labor (spontaneous, induced or pre-labour CS), 3) gestational age (preterm or term), 4) fetal presentation (cephalic, breech or transverse) and 5) number of fetuses (one or more than one, Table 1).
| Table 1: The Robson Ten-Group Classification System (RTGCS) | |
| 1 | Nulliparous, singleton, cephalic, ≥ 37 weeks’ gestation, in spontaneous labour |
| 2 | Nulliparous, singleton, cephalic, ≥ 37 weeks’ gestation, induced labour or CS before labour |
| 2a | Nulliparous, singleton, cephalic, ≥ 37 weeks’ gestation, induced labour |
| 2b | Nulliparous, singleton, cephalic, ≥ 37 weeks’ gestation, CS before labour |
| 3 | Multiparous (excluding previous cesarean section), singleton, cephalic, ≥ 37 weeks’ gestation, in spontaneous labour |
| 4 | Multiparous without a previous uterine scar, with singleton, cephalic pregnancy, ≥ 37 weeks’ gestation, induced or CS before labour |
| 4a | Multiparous without a previous uterine scar, with singleton, cephalic pregnancy, ≥ 37 weeks’ gestation, induced labour |
| 4b | Multiparous without a previous uterine scar, with singleton, cephalic pregnancy, ≥ 37 weeks’ gestation, CS before labour |
| 5 | Previous cesarean section, singleton, cephalic, ≥37 weeks’ gestation |
| 6 | All nulliparous with a single breech |
| 7 | All multiparous with a single breech (including previous CS) |
| 8 | All multiple pregnancies (including previous CS) |
| 9 | All women with a single pregnancy in transverse or oblique lie (including those with previous CS) |
| 10 | All singleton, cephalic, < 37 weeks’ gestation pregnancies (including previous CS) |
| CS: Cesarean Section. (Robson MS. Classification of cesarean sections. Fetal Matern Med Rev.2001; 12: 23–39) | |
Notwithstanding there is no standard classification system that exists for Cesarean section indications, C-sections are performed for maternal or/and fetal complications. The medical indications for CS can be one or multiple or related. The four most common medical indications for cesarean delivery according to the international literature account for approximately 80% of these deliveries were failure to progress during labor (30%), previous CS (30%), fetal jeopardy (10%), malpresentation (10%). A Multi-Country Study done in Sub-Saharan Africa countries showed the most common indications were obstructed labor (31%), poor presentation (18%), previous Cesarean section (14%), and fetal distress (10%), uterine rupture (9%) and antepartum hemorrhage (8%) [9]. Some facility- based studies showed most common indications of C-sections were fetal distress, repeat CS (24%), prolonged labour/abnormal labor, oligohydramnios, malpresentation, CPD, etc [21,22]. A systemic review and meta-analysis are done in Ethiopia showed the most common indication of CS was non-reassuring fetal heart rate pattern followed by cephalopelvic disproportion (CPD) [23].
The aim of this study was to compare and analyze the cesarean section using RTGCS, and to identify the medical indications which contributed to each RTGCS in private and public health institutions.
A facility-based retrospective cross-sectional study was conducted from January 1, 2017, to December 31, 2017, to analyze CSss performed at public and private hospitals. The public hospital was Tikur Anbessa Specialized Hospital (TASH) which is a tertiary referral public and teaching hospital under Addis Abeba University with approximately 5,500-6,000 deliveries conducted annually, and also serves mostly high-risk and /or referred cases and provided free of charge. The department of obstetrics & gynecology staffed with sub-specialists, general obstetrician-gynecologists, residents, medical interns and mid-wives., and one selected private hospital in Addis Abeba, the capital city of Ethiopia. The private hospital is a Maternal-child hospital (MCH) working 24/7 for-profit and has 1200-1400 deliveries per year, and staff with general obstetrician-gynecologists and midwives. Mothers who delivered a baby after fetal viability (28 weeks and/or newborn weight ≥ 1 kg) with complete information needed for Robson’s classification were included, while those who were admitted to the postnatal ward after delivery in other health facilities were excluded from this study.
The deliveries during the study period traced from Health Management Information Systems (HMIS) delivery registry form. Mothers chart who delivered by CS retrieved from each hospital record room using medical registration number. Then all necessary variables, including indication for C-section, parity, gestational age, presentation, the onset of labor, previous c-scar were taken. The identity of women who underwent CS was obtained from the delivery logbook, and operation logbook. The files that met the inclusion criteria were recruited according to the sequence of occurrence in the register. All data quality, indications, and eligibility of cases were confirmed by the main investigator. This register was counter-checked for any double entries and if it was so discovered, one of the data collection sheets was withdrawn and discarded and the serialization rectified before recruitment is continued. The data for this study were collected after ethical clearance was obtained from the Department Research and Publication Committee (DRPC), Addis Abeba University, College of Health Sciences and permission was also obtained from the medical directors of the respective hospitals. The information obtained from the records used only for the purpose of this study and kept confidential. Finally, the collected data were entered into SPSS version 20 for analysis. The variables with p < 0.2 on bivariate logistic regression were taken to multivariable logistic regression to control possible confounding factors. Finally, an adjusted odds ratio with a 95% confidence interval was used to measure the strength of association between the predictors and occurrence of CS. Statistical significance was declared at p < 0.05.
In this study, Non-reassuring fetal status (NRFS) defines CS done for indications of non-reassuring fetal heart pattern/fetal distress, non-reassuring biophysical profile, intrauterine growth restriction (IUGR), cord prolapse/presentation, meconium staining amniotic fluid (MSAF) with labor abnormalities.
Robson’s Ten Group Classification System (RTGCS): is standard cesarean section classification systems that divide women admitted for delivery into 10 mutually exclusive and totally inclusive categories.
A total of 6814 deliveries were conducted in selected hospitals during the study period. Of those, 5586(82%) delivered at public and 1228(18%) at the private MCH Centre. Deliveries with an incomplete chart, incorrectly labeled and records not located were excluded. Finally, 5886(86.4%) women were included then classified using Robson’s ten group classification systems (Flow chart 1).
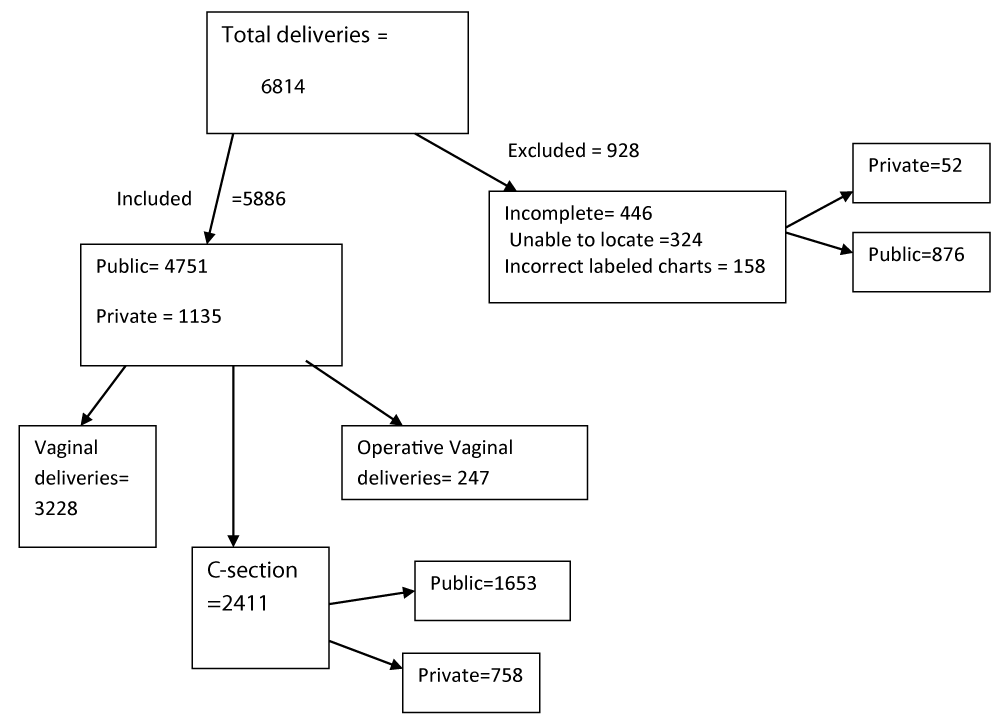
Figure 1: Study flow chart.
haracteristics of the women in the study
The mean age of women delivered in both hospitals was 27.32 ± 4.72; at public the mean age was 26.78 (SD ± 4.66 (range 16-46); whereas at private MCH hospital mean age was 29.6 ± 4.27 (range 18-47). The majorities of women were parous, at term with singleton and cephalic pregnancy, no previous C-scar, and had spontaneous labour with normal birth weight outcomes in both hospitals. In public, the vaginal route is the most common mode of delivery but in private more than two times of women delivered by CS than vaginal (Table 2).
Statistically, a significant association was observed between the place of delivery, age, fetal presentation, the onset of labor, previous c-s scar, and mode of delivery (Table 2).
| Table 2: Socio-demographic and obstetric conditions of study participants, Addis Abeba, Ethiopia, 2017. | ||||||
| Variable | Place of delivery | |||||
| Public N=4751 | Private N=1135 | |||||
| Frequency(no.) | % | Frequency | % | p - value | ||
| Age | < 20 years | 171 | 3.6 | 6 | 0.5 | < 0.001 |
| 20-34 years | 4201 | 88.4 | 962 | 84.8 | ||
| ≥ 35 years | 379 | 8.0 | 167 | 14.7 | ||
| Parity | Nulliparous | 2090 | 44.0 | 478 | 42.1 | 0.513 |
| Primiparous | 1507 | 31.7 | 370 | 32.6 | ||
| Multiparous | 1154 | 24.3 | 287 | 25.3 | ||
| Plurality of pregnancy | Singleton | 4633 | 97.5 | 1114 | 98.1 | 0.160 |
| Twins | 115 | 2.4 | 19 | 1.7 | ||
| Triplets | 3 | 0.1 | 2 | 0.2 | ||
| Gestational age | < 37 weeks | 434 | 9.1 | 75 | 6.6 | 0.007 |
| ≥ 37 weeks | 4317 | 90.9 | 1060 | 93.4 | ||
| Presentation | Cephalic | 4466 | 94.0 | 1084 | 95.5 | < 0.001 |
| Breech | 274 | 5.8 | 36 | 3.2 | ||
| Transverse/oblique | 11 | 0.2 | 15 | 1.3 | ||
| Onset of labor | Spontaneous | 3679 | 77.4 | 627 | 55.2 | < 0.001 |
| Induced | 465 | 9.8 | 136 | 12.0 | ||
| No labor | 607 | 12.8 | 372 | 32.8 | ||
| Previous CS scar | No scar | 4236 | 89.2 | 801 | 70.6 | < 0.001 |
| 1 CS scar | 403 | 8.5 | 220 | 19.4 | ||
| ≥ 2 CS scar | 108 | 2.3 | 112 | 9.9 | ||
| Other uterine scar | 4 | 0.1 | 2 | 0.2 | ||
| Mode of delivery | Vaginal delivery | 2800 | 58.9 | 368 | 32.4 | < 0.001 |
| C-section | 1653 | 34.8 | 758 | 66.8 | ||
| Vaginal breech delivery | 59 | 1.2 | 1 | 0.1 | ||
| Operative vaginal delivery | 239 | 5.0 | 8 | 0.7 | ||
| Birth weight (grams) |
< 1000 | 15 | 0.3 | 3 | 0.3 | < 0.000 |
| 1000-1499 | 75 | 1.6 | 7 | 0.6 | ||
| 1500-2499 | 427 | 9.0 | 53 | 4.7 | ||
| 2500-3999 | 3980 | 83.8 | 912 | 80.4 | ||
| ≥ 4000 | 254 | 5.3 | 160 | 14.1 | ||
Characteristics of women underwent CS
The overall CS rate was 41% (2411):34.8% in the public hospital and 66.8% in private MCH. The mean age of women delivered by CSin both hospitals was 28.37 years (SD ± 4.6); at public the mean age was 27.65 years (SD ± 4.58, range 16-46) and 29.93 ± 4.33 (range 20-47) at private MCH. Majority women who delivered by CS were parous, at term with singleton and cephalic pregnancy, without previous CS and normal birth weight outcome in both hospitals. For the majority of women who undergone CS in public labour initiated spontaneously but in private MCH majority CS, was done pre-labour (Table 3).
Statistically, a significant association was observed between the place of delivery, and age, the order of pregnancy, gestational age, fetal presentation, the onset of labor, previous c-s scar, and newborn weight (Table 3).
| Table 3: Characteristics of mothers who delivered by CS, Addis Abeba, Ethiopia, 2017. | ||||||
| Place of delivery | ||||||
| Variable | Public Hospital N=1653 | Private MCH N=758 | p - value | |||
| Frequency (no.) | % | Frequency (no.) | % | |||
| 0.000 | ||||||
| Age | ≤ 20 years | 96 | 5.8 | 7 | 0.9 | |
| 21-34 years | 1401 | 84.8 | 622 | 82.1 | ||
| ≥ 35 years | 156 | 9.4 | 129 | 17.0 | ||
| Parity | Nulliparous | 739 | 44.7 | 326 | 43.0 | 0.436 |
| Parous | 914 | 55.3 | 432 | 57.0 | ||
| Plurality of pregnancy | Singleton | 1577 | 95.4 | 739 | 97.5 | 0.03 |
| Multiple pregnancy(twins&triplets) | 78 | 4.6 | 19 | 2.5 | ||
| Gestational age | < 37 weeks | 196 | 11.9 | 51 | 6.7 | 0.007 |
| ≥ 37 weeks | 1457 | 88.1 | 707 | 93.3 | ||
| Presentation | Cephalic | 1438 | 87.0 | 709 | 93.5 | 0.001 |
| Breech | 204 | 12.3 | 34 | 4.5 | ||
| Transverse | 11 | 0.7 | 15 | 2.0 | ||
| Onset of labor | Spontaneous | 877 | 53.1 | 294 | 38.8 | 0.001 |
| Induced | 174 | 10.5 | 92 | 12.1 | ||
| No labor | 602 | 36.4 | 372 | 49.1 | ||
| Previous CS scar | No scar | 1210 | 73.2 | 436 | 57.5 | 0.001 |
| 1 CS scar | 336 | 20.3 | 208 | 27.4 | ||
| ≥ 2 CS scar | 107 | 6.5 | 114 | 15.1 | ||
| Newborn wt (grams) |
<1000 | 12 | 0.7 | 2 | 0.3 | 0.001 |
| 1000-1499 | 52 | 3.1 | 4 | 0.5 | ||
| 1500-2499 | 183 | 11.1 | 34 | 4.5 | ||
| 2500-3999 | 1286 | 77.8 | 599 | 79.0 | ||
| ≥ 4000 | 120 | 7.3 | 119 | 15.7 | ||
Analysis based on Robson’s Classification
For each group, relative size (total deliveries in each group/total delivery), the CS group rate (number of CS in the group/total number of deliveries in the group), relative contribution (CS deliveries in each group/total number of CS deliveries) and absolute contribution (CS deliveries in each group/ total deliveries) were calculated (Table 4).
| Table 4: CS distribution among Robson groups in both public and private hospitals, Addis Abeba, Ethiopia, 2017. | ||||||||||||
| Robson group | Number of C-section(A) | No. of deliveries (B) | Relative(%) group sizea | Group CS rateb (%) | Relative(%) contributionc | Absolute(%) contributiond | ||||||
| TASH (N) | Private (N) | TASH (N) | Private(N) | TASH (%) |
Private (%) | TASH (%) | Private (%) | TASH (%) | Private (%) | TASH (%) | Private (%) | |
| 1 | 368 | 164 | 1488 | 285 | 31.3 | 25.1 | 24.7 | 57.5 | 22.3 | 21.6 | 7.7 | 14.4 |
| 2 | 185 | 119 | 287 | 138 | 6.0 | 12.2 | 64.5 | 86.2 | 11.2 | 15.7 | 3.9 | 10.5 |
| 2a | 112 | 12 | 169 | 16 | 3.5 | 1.4 | 66.3 | 75 | 6.8 | 1.6 | 2.4 | 1.1 |
| 2b | 73 | 107 | 118 | 122 | 2.5 | 10.8 | 61.8 | 87.7 | 4.4 | 14.1 | 1.5 | 9.4 |
| 3 | 212 | 48 | 1555 | 227 | 32.7 | 20.0 | 13.6 | 21.1 | 12.8 | 6.3 | 4.5 | 4.2 |
| 4 | 117 | 37 | 266 | 60 | 5.6 | 5.3 | 44.0 | 61.7 | 7.1 | 4.9 | 2.5 | 3.3 |
| 4a | 27 | 2 | 85 | 7 | 1.8 | 0.6 | 31.8 | 28.6 | 1.6 | 0.3 | 0.6 | 0.2 |
| 4b | 90 | 35 | 181 | 53 | 3.8 | 4.7 | 49.7 | 66.0 | 5.5 | 4.6 | 1.9 | 3.1 |
| 5 | 371 | 295 | 439 | 306 | 9.2 | 27.0 | 84.5 | 96.4 | 22.4 | 38.9 | 7.8 | 26.0 |
| 6 | 79 | 15 | 104 | 17 | 2.2 | 1.5 | 76.0 | 88.2 | 4.8 | 2.0 | 1.7 | 1.3 |
| 7 | 91 | 12 | 131 | 12 | 2.8 | 1.1 | 69.5 | 100 | 5.5 | 1.6 | 1.9 | 1.1 |
| 8 | 76 | 19 | 118 | 21 | 2.5 | 1.9 | 64.4 | 90.5 | 4.6 | 2.5 | 1.6 | 1.7 |
| 9 | 11 | 14 | 11 | 14 | 0.2 | 1.2 | 100 | 100 | 0.7 | 1.8 | 0.2 | 1.2 |
| 10 | 143 | 35 | 352 | 55 | 7.4 | 4.8 | 40.6 | 63.6 | 8.7 | 4.6 | 3.0 | 3.1 |
| Total | 1653 | 758 | 4751 | 1135 | 100 | 100 | 100 | 100 | 34.8 | 66.8 | ||
| aRelative group size (B/total no. of deliveries × 100) bGroup CS rate (A/B × 100) cRelative contribution to the overall CS rate (A/total no. of CS × 100) dAbsolute contribution of each group to the overall CS rate (A/total deliveries × 100) |
||||||||||||
Almost 80% of women were from groups 1, 2, 3, and 5, while groups 6, 7, 8, and 9 accounted for only 7.3% of deliveries. Robson groups 1 and 3 comprising 60% of deliveries (Table 4).
Almost three-quarter (73.1%) of all C-Sections performed were from Robson groups 1, 2, 3, and 5. Groups 1 and 5 contributed nearly half (49.7%) of CS performed. Robson groups 6, 7, 8, and 9 accounted for 13% of CS rate.
The analysis of CS rates by the group showed that within Robson group 1 (nulliparous, cephalic, term, spontaneous labor), the CS rate was more than two-fold higher in the private MCH than the public sector (57.5% in private and 24.7% in public), and nearly the same occurred within group 3 (Multiparous (excluding previous cesarean section), singleton, cephalic, ≥ 37 weeks’ gestation& spontaneous labour; 21.1% in private MCH and 13.6% in public). The CS rate in groups 4a and 9 was not much difference between the public and private sector. However, there was a huge difference when all women from groups 2, 3, 7, 8 and 10 were considered (group 2: 64.5% in public vs. 86.2% in private; group 3: 44% in public vs. 61.7% in private; group 7: 69.5% in public vs. 100% in private; group 8: 64.4% in public vs. 90.5% in private, and group 10:40.6% in public vs. 63.6% in private, Table 4).
Comparing the absolute contribution of CS (CS deliveries in each group/total deliveries x100) by place of delivery, women in Robson group 1, 2, 5 & 9 are two times and more higher for contribution of CS in private than public (14.4% vs. 7.7%; 10.5% vs. 3.9%; 26% vs. 7.8%; 1.2% vs. 0.2% respectively).Also, more than half of CS contribution was by the above Robson groups for each places (Table 4).
When analyzing which medical indications contributed to each Robson group, 41.3% of CS was done under Robson group 1 & 2 for an indication of non-reassuring fetal status (NRFS) followed by Cephalopelvic disproportion (CPD,10.7%) then failed induction(9.4%). For Robson group 3&4, 16.5% CS was done for an indication of NRFS followed by CPD (3.6%). Under Group 5, nearly two-quarter of (38.8%) CS was done for repeat one previous CS scar then followed by ≥2 Previous CS scar (20.1%).In group 6,7,9 the leading medical indication was malposition/malpresentation (4.8%,3.3%,2.6% respectively); whereas in group 8 & 10, multiple pregnancy(6.1%) and NRFS(4.7%) were the leading indications respectively (Figure 2).
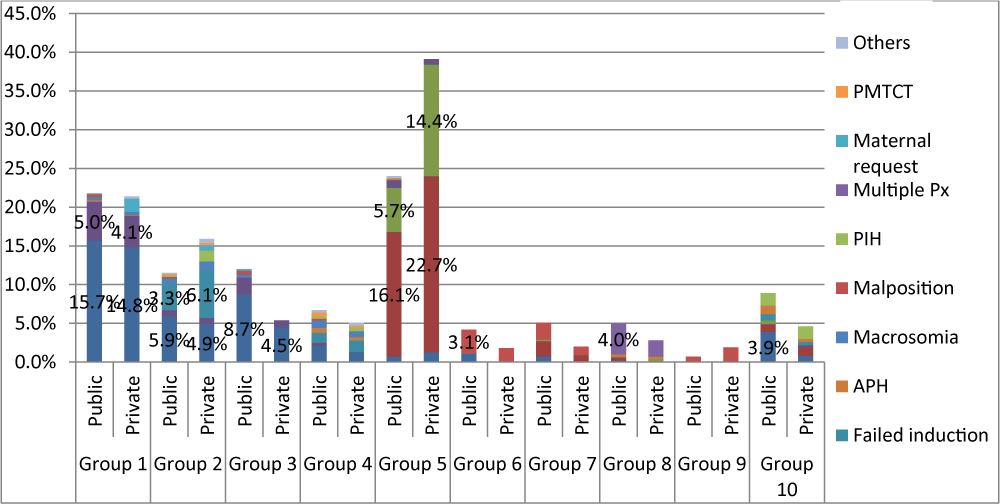
Figure 2: Medical indications of CS in each Robson group among public and private hospitals of Addis Abeba, Ethiopia, 2017.
In a public hospital, NRFS was the leading medical indication in Robson Group 1, 2, 3 & 10 and it was also a leading indication for group 1 & 3 in private. CPD was the second common indication for Robson group 1 in both hospitals (5% vs. 4.1% in public and private respectively) and group 3 in a public hospital (2.2%). Failed induction was the second common indication for Robson group 4 in both hospitals and group 2 public hospital; however, it is the leading indication for Robson group 2 in a private hospital (6.1%, Figure 2).
In public, according to medical indications for C-section, the commonest indications were non-reassuring fetal status (39.1%) followed by previous CS scar (25.9%) then CPD (9.4%); whereas in private, the most frequent indications were previous CS scars (39.4%) followed by non-reassuring fetal status (27.6%) then failed induction (7.9%). More than seventy percent of CS was done due to the above indications in both hospitals (Table 5).
| Table 5: Indications of Csin public and private hospitals, Addis Abeba, Ethiopia, 2019. N=2411. | ||||||
| Indications | Place of delivery | |||||
| TASH | Private MCH Center | Total | ||||
| Number of cases | % | Number of cases | % | Number | % | |
| Non-reassuring fetal status/NRFSa | 647 | 39.1 | 209 | 27.6 | 856 | 35.5 |
| Previous CS scarb | 322 | 19.5 | 188 | 24.8 | 510 | 21.2 |
| ≥ 2 previous CS scar | 106 | 6.4 | 111 | 14.6 | 217 | 9.0 |
| Cephalopelvic Disproportion/CPDc | 155 | 9.4 | 52 | 6.9 | 207 | 8.6 |
| Malpresentation/malpositiond | 122 | 7.4 | 36 | 4.7 | 158 | 6.6 |
| Failed induction | 90 | 5.4 | 60 | 7.9 | 150 | 6.2 |
| Multiple pregnancy(twins & triplet) | 68 | 2.8 | 16 | 0.7 | 84 | 3.5 |
| Big baby | 43 | 2.6 | 18 | 2.4 | 61 | 2.5 |
| Antepartum hemorrhage (APH) | 41 | 2.5 | 9 | 1.2 | 50 | 2.1 |
| Pregnancy induced Hypertension (PIH) | 32 | 1.9 | 27 | 3.6 | 59 | 2.4 |
| Maternal request | 5 | 0.3 | 18 | 2.4 | 23 | 1.0 |
| PMTCT | 11 | 0.7 | 4 | 0.5 | 15 | 0.6 |
| Othersa | 11 | 0.7 | 10 | 1.3 | 21 | 0.9 |
| Total | 1653 | 100.0 | 758 | 100.0 | 2411 | 100 |
| aNRFS includes; non reassuring fetal heart rate pattern NRFHRP, Non-reassuring biophysical profile, cord prolapse/presentation, Meconium staining amniotic fluid in LFSOL, labor abnormality with meconium in active first stage, fetal growth restriction bCPD: Cephalopelvic Pelvic Disproportion cOthers: active herpes infection, repaired fistula, bad obstetrics history, dMalpresentation/malposition (brow, transverse, or breech, shoulder, oblique ,persistent face presentation, posterior ascyclitism) |
||||||
Among total CS (2411), more than one-third (35.5%) of the indication for CS was non-reassuring fetal status followed by one previous CS scar (510, 21.2%) then more than one previous CS scar (217, 9%) (Table 5).
Statistically, a significant association was observed between the route of delivery versus a place of delivery, having previous CS scar or not, age, the onset of labor, gestational age, the plurality of pregnancy, presentation of fetus, and Robson groups 2-8 & 10(not shown in the table). Pregnant mothers who delivered at private, had previous CS scar, age (≥ 21 years), induced labor, gestational age less than 37 weeks, with multiple pregnancies and Robson groups 2, 4-8 & 10 (group 3 less likely to delivery by CS) are more likely to delivery by CS section than the vaginal route. After adjusted for parity and the above variables, all variables are significant except all Robson groups and gestational age. Mothers who delivered in private had 3.8 times odds ratio of being delivered by CS; similarly, mothers with previous CS scar were18.8 times of odds ratio being delivered by CS (Table 6).
| Table 6: Factors affecting route of delivery, Addis Abeba, Ethiopia, 2017. | ||||
| Route of delivery | ||||
| Variables | Vaginal route | C-section | Crudes Odds Ratio (COR 95%CI) | Adjusted Odds Ratio (AOR,95% CI) |
| Place of delivery | N (%) | N (%) | ||
| Public | 3098(89.2) | 1653(68.6) | 1 | |
| Private | 377(10.8) | 758(31.4) | 3.768(3.285-4.322)* | 2.738(2.30-3.259)* |
| Previous CS scar | ||||
| No CS scar | 3392(97.6) | 1651(68.5) | 1 | |
| CS Scar(≥1CS scar) | 83(2.4) | 760(31.5) | 18.812(14.886-23.774)* | 10.479(3.980-27.588)* |
| Age | ||||
| ≤ 20 years | 350910.1) | 103(4.3) | 1 | |
| 21-34 years | 2864(82.4) | 2023(83.9) | 2.40(1.913-3.012)* | 1.878(1.443-2.444)* |
| ≥ 35 | 261(7.5) | 285(11.8) | 3.711(2.814-4.892)* | 2.381(1.651-3.434)* |
| Onset of labor | ||||
| Spontaneous | 3135(90.2) | 1171(48.6) | 1 | |
| Induced | 340(9.8) | 266(11.0) | 2.093(1.111-3.952)* | 1.982(1.053-3.729)* |
| No labor | 0 | 974(40.4) | ||
| Gestational Age | ||||
| <37 weeks | 262(7.5) | 247(10.2) | 1.400(1.167-1.679)* | 1.381(0.701-2.720) |
| ≥ 37 weeks | 3213(92.5) | 2164(89.8) | 1 | |
| Plurality of pregnancy | ||||
| Singleton | 3431(98.7) | 2316(96.1) | 1 | |
| Multiple(twin&triplet) | 44(1.3) | 95(3.9) | 3.199(2.229-4.590) | 3.38(1.539-5.998)* |
| Presentation | ||||
| Cephalic | 3403(97.9) | 2147(89.1) | 1 | |
| Non-cephalic | 72(2.1) | 264(10.9) | 5.812(4.454-7.584)* | 7.206(2.302-22.562)* |
| AOR: Adjusted for parity, Robson groups (1-10), no of pregnancy, indications, onset of labor, presentation, having scar or not, age, plurality, place of delivery. *p < 0.05 |
||||
Binary regression was done to identify factors that affect the CS in the two hospitals. Mothers who delivered by CS section at the private hospital those who had previous CS scars, age ≥21 years, gestational age, ≥ 37 weeks, no spontaneous labor, medical indications (with failed induction, maternal request, one & ≥ 2 CS scar), Robson groups (2,5,9) are more likely to deliver by CS than mothers who delivered in the public hospital. Conversely, mothers in the private hospital those who had multiple pregnancies, a fetus with non-cephalic presentation and Robson groups (3,6,7, 10) are less likely to deliver by CS section than the public hospital (Table 7).
| Table 7: Factors affecting CS in public vs. private hospitals, Addis Abeba, Ethiopia, 2017. | ||||
| Place of C-section | Crude Odds Ratio | Adjusted Odds Ratio | ||
| Variables | Public | Private | COR 95%CI) | AOR,95% CI) |
| N (%) | N (%) | |||
| Age | ||||
| ≤ 20 years | 375(22.7) | 64(8.4) | 1 | |
| 21-34 years | 1122(67.9) | 565(74.5) | 2.951(2.222-3.918)* | 3.096(2.289-4.188)* |
| ≥ 35 years | 156(9.4) | 129(17.0) | 4.845(3.404-6.897)* | 5.012(3.385-7.420)* |
| Having previous CS scar | ||||
| No | 1213(73.4) | 438(57.8) | 1 | |
| Yes | 440(26.6) | 320(42.2) | 2.014(1.681-2.413)* | 2.907(1.370-6.169)* |
| Gestational age | ||||
| < 37 weeks | 196(11.9) | 51(6.7) | ||
| ≥ 37 weeks | 1457(88.1) | 707(93.3) | 1.865(1.353-2.571)* | 0.515(0.235-1.128) |
| Onset of labor | ||||
| Spontaneous | 877(53.1) | 294(38.8) | 1 | 1 |
| Induced | 174(10.5) | 92(12.1) | 1.577(1.186-2.098)* | 2.539(1.401-4.600)* |
| Prelabor | 602(36.4) | 372(49.1) | 1.843(1.532-2.217)* | 2.194(1.604-3.00)* |
| Plurality | ||||
| Singleton | 1577(95.4) | 739(97.5) | ||
| Multiple(twin & triplet | 76(4.6) | 19(2.5) | 0.533(0.32-0.889)* | 0.187(0.053-0.653)* |
| Indications | ||||
| APH | 41(2.5) | 9(1.2) | 1 | 1 |
| Failed induction | 90(5.4) | 60(7.9) | 3.037(1.376-6.705)* | 1.744(0.731-4.158) |
| Maternal request | 5(0.3) | 18(2.4) | 16.4(4.814-55.866)* | 7.672(2.103-27.984)* |
| One CS scar | 322(19.5) | 188(24.8) | 2.660(1.264-5.595)* | 1.007(0.404-2.510) |
| PIH | 32(1.9) | 27(3.6) | 3.844(1.587-9.311)* | 4.226(1.630-10.654)* |
| ≥ 2 CS scar | 106(6.4) | 111(14.6) | 4.77(2.211-10.293)* | 1.044(0.402-2.710) |
| Presentation | ||||
| Cephalic | 1438(87) | 709(93.5) | ||
| Non-cephalic | 215(13) | 49(6.5) | 0.462(0.335-0.639)* | 1.087(0.367-3.218) |
| *p < 0.05 | ||||
| AOR: Adjusted for parity, Robson groups(1-10),no of pregnancy, indications, onset of labor, presentation, having scar or not, age, plurality of pregnancy. | ||||
After adjusted with parity and the above variables, all variables are significant except gestational age, fetal presentation, and a medical indication of failed induction & CS scars. Mothers who delivered in private by CS whose age greater than 20 years (AOR 3.1, 95% CI 2.3-4.2) & > 34 years (AOR 5.0,95% CI 3.3-7.4), had previous Cs scar (AOR 2.9, 95% CI 1.4-6.2), a medical indication with the maternal request (AOR 7.7, 95% CI 2.1-27.98) and PIH (AOR4.2, 95% CI 1.6-10.7) , induced labor (AOR 2.5, 95% CI 1.4-4.6), prelabored CS (AOR 2.2, 95% CI 1.6-3.0) were more likely to undergo CS than public hospital (Table 7).
The overall CS rate was 41% (34.8% in public, 66.8% in private). Almost three-quarters of CSss performed were from Robson groups 1, 2, 3, and 5. Robson group 1 (nulliparous, cephalic, term, spontaneous labor) and group 3 [Multiparous (excluding previous cesarean section), singleton, cephalic, ≥ 37 weeks’ gestation& spontaneous labor], the CS rate was more than two-fold higher in the private than the public. Women in Robson groups 1, 2, 5 & 9 are two and more times higher for the absolute contribution of CS in private than public. The most common medical indication for CS in public was non-reassuring fetal status; however, in private previous CS scars were the top indications. CS scar [having previous CS scar, Robson group 5(Previous cesarean section, singleton, cephalic, ≥ 37 weeks’ gestation) and an indication of repeat CS for previous CS scar] is the likely factor that increased the CS rate in private when compared with public hospital.
In this study, the overall CS rate is higher than from national CS rate (41% vs.1.9%), previous Studies, and WHO recommendations [14,19-22,24]. The rate of CS in a private hospital was twice (66.8%) higher than a public hospital (34.8%) and also statistically significant (p < 0.001). This is comparable with other studies done in Ethiopia [24-28] and other developing [16,29,30] and developed countries [31,15,32]. However, this finding is lower than the report from private hospitals in Mexico (85%) and Brazil (86.2%) where the highest rate of Cesarean delivery has been reported in the world [33,34]. The high CS rate may be explained, the public hospital is a tertiary referral & teaching hospital in the country which manages complicated and referred cases; and also residents might intervene earlier due to fear of the outcomes &consultants. Some of the other driving forces attributed to the increased cesarean delivery rate in the private may be medically unnecessary indications such as maternal request, unfavorable cervix, decreased vaginal birth after cesarean scar, and failed induction.
This study used the Robson Ten-Group Classification systems (RTGCS) to emphasize the particular subgroups of women who make the most significant contributions to the CS rate within the study setting. Almost three-quarter (73.2%) of all C-sections performed were from Robson groups 1, 2, 3, and 5. In both hospitals, the main contributing groups to the overall CS rate were the Previous CS (Group 5) and nulliparity groups (Groups 1 and 2), i.e., giving the contribution rate of 62.3%. Our findings are in line with a study done in hospitals from Tanzania and South Africa where the three major groups (1, 3, and 5) were the same, though in a different order. In South Africa, groups 1, 5, and 3 while in Tanzania groups 1, 3, and 5 were the leading contributors. This may be related to variations in population demographics, overall CS rates, and the success and rate of induction [17,35-37].
Previous CS scar only attributed more than one-quarter (27.6%) of the total CS rate. when it distributed to the relative contribution of CS for each it is greater in private (38.9%) than public (22.4%). This may show the decrement of the trial of labor in previous CS scar especially in private which is comparable to report in private – fee – for service hospital from South Africa (46.8%), seems to leave no room for VBAC [19,38]. The national-guideline recommended vaginal birth after CS(VBAC) if the estimated fetal weight is less than 4000 grams, the pelvis is medically adequate, no other uterine scar, singleton & cephalic pregnancy, no malposition and malpresentation, one previous lower transverse CS and mother opted for the trial of labor (TOL) after the above criteria are fulfilled [3].
On the other hand, being nulliparity (group 1 and 2) contributed almost for one-third (34.7%) of the total CS rate (37.3 vs. 33.5 in private and public respectively). Those groups are amenable for intrapartum labor abnormalities/dystocia and, also will inevitably increase Group 5 and will become an even more important contributor to the overall CS rate in the future. Interestingly, the nulliparity groups are the top leading contributors to the total CS rate followed by previous CS. Groups 2a & 2 b (Nulliparous, singleton, cephalic, ≥ 37 weeks’ gestation, induced labour and prelabor CS respectively) the rate and success of induction dramatically low, however, prelabour CS is much higher which is more at private than public (87.7% vs. 62%).
Therefore, efforts to reduce the overall CS rate (especially primary CS) should include selecting cases for the avoidance of unnecessary primary cesarean section by increasing the rate and success of induction, redefining dystocia, continuous labor and delivery support, standardized fetal heart rate interpretation and management, encouraging VBAC for women who are an appropriate candidate [39,40]. A meta-analysis of VBAC has provided level 1evidence that VBAC is a safe alternative to repeat cesarean section for both mother and infant. The major risk of the trial of labor is uterine rupture and hemorrhage and possible hysterectomy can be reduced by careful patient selection and careful intrapartum follow up [41-43].
When the CS analyzed in private and public examined individually based on the Robson groups [1-10], the leading contributors for CS rate in the private were Robson groups 5,1,2,3 on descending order; whereas in the public Robson groups 5,1,3,2 on descending order contributed for two-third of the CS. A study was done in other parts of Ethiopia, Brazil, Peru, Oman showed similar trends on the leading contributors in private and public [17,35,44,45]. However, the greatest variations between the public and private were significant in group 5, previous CS and singleton cephalic ≥ 37 weeks (38.9% vs. 22.4% in private and public respectively), group 3, spontaneously laboring multiparous (12.8% vs. 6.3% in public and private respectively), group 2a, induced nulliparous (6.8% vs. 1.6% in public and private respectively), group 2b, nulliparous prelabour CS (14.1% vs. 4.4% in private and public respectively), group 4a, induced multiparous (1.6% vs. 0.3% in public and private respectively).In other groups [6-10], even though there was significant variation, the contribution for total CS rate was 20% (24.2% vs. 12.5% for public and private CS respectively) due to unavoidable obstetric indications (breech presentation, multiple pregnancies, abnormal fetal lies or preterm deliveries). When compared with other studies internationally, almost all studies suggested comparable results in groups 6-10 [35,45,46].
In this study, the medical indication of CS was analyzed to identify the most common contributors for each Robson group which may help to act interventions to minimize and possibly avoiding unnecessary medical indication and also to look for other options. The most common medical indications were non-reassuring fetal status (NRFS - 35.5%) followed by repeat CS for previous one C-scar (21.2%) then two and above Previous C-Scar (9%) and Cephalopelvic disproportion (8.6%) in both hospitals. However, a meta-analysis and systemic review of a national cesarean section and a Sub-Saharan Africa studies reported cephalopelvic disproportion(CPD) as the main indication for cesarean delivery followed by non-reassuring heart fetal heart rate pattern [9,13,23] but in other countries, the leading indication was a fetal compromise [21,22]. This portion can be lowered by implementing cardiotocography (CTG) during labor, doing the whole components of the biophysical profile including non-stress test, frequent teaching workshops for the obstetric staff about the interpretation of intrapartum fetal heart abnormalities, and non-surgical management options, teaching mothers the dis-/advantage of CS.
In public the top medical indications of CS were NRFS (39.1%) followed by previous one C-scar (19.5%) then CPD (9.4%); whereas, in private the top indication was NRFS (27.6%) followed by one previous C-scar (24.8%) then two and above Previous C-Scar (14.6%). The above medical indications showed NRFS persistently the foremost physician indication in both hospitals. In addition, at private 10% of CS was due to failed induction and maternal request mostly done for nulliparous groups. This indication will increase the primary CS rate and on the next pregnancy, the repeat CS might be inevitable and become a vicious cycle. Such types of medical insignificant indications should be minimized by assessing bishop score (includes cervical dilation, cervical effacement, station, position & consistency of the cervix) carefully and ripen the cervix (if it is unfavorable) instead of starting induction right away. Also, an evidence-based practice should be implemented for the management of IUGR instead of doing CS for all. In addition to the above, mothers should be counseled on possible benefits and complications (immediate and late) of CS better during their antenatal care, before they came in labor.
Mothers who delivered in private had 2.7 times of being delivered by CS than public; similarly, mothers with previous CS scars were 10.5 times of being delivered by CS than no previous CS scar. Also, mothers with induced labor, age ≥ 35 years, multiple pregnancies, non-cephalic presentation had a higher likelihood of being delivered by CS. This finding is in line with a study conducted in other parts of Ethiopia, Thailand and Brazil [16,29,46,47] [48,49]. This might be explained by mothers who can afford private hospital service could prefer elective cesarean delivery due to fear of labor pain (e.g. maternal request). Another possible explanation might be health care providers’ poor adherence or practice as per the national protocol in private hospitals and also it could be due to the indication and type of incisions in previous cesarean delivery. The age may be due to increased numbers of parity and previous CS scar /or old nulliparous as a precious baby.
Those mothers who underwent CS in private with the age of 21-34 and ≥ 35, having previous CS scars, induced & prelabor, medical indications of maternal request (7 times) and pregnancy-induced hypertension were the likely contributing factors for having CS in private compared to those mothers who had CS in public. This finding persistently showed CS scar [having previous CS scar, Robson group 5 (Previous cesarean section, singleton, cephalic, ≥ 37 weeks’ gestation) and an indication of repeat CS for previous CS scar] is the likelihood factor which increased the CS rate in private when comparing with the public. So, every effort should be tried to decrease CS in private those mothers with previous CS scar by selecting cases and counseling for VBAC according to national protocol and other international guidelines instead of doing CS for-profit.
Generalization of this study may not be applied in other set-ups because the public hospital expected to serve for more complicated and referred cases which might have high CS rate/interventions.
The other reason will be the innate deficit of Robson classification which doesn’t specify the lowest GA (only said < 37 weeks), in Ethiopia the cut point of viability is ≥ 28 weeks of gestation but in other countries, it may be ≥ 24 weeks or ≥20 weeks. So using this research for continental or international comparison should be cautiously applied. Accessing all CS files was difficult because of the non-digital archiving of hospital files.
We feel that incompleteness of information and inability to locate medical records weren’t associated to any outcomes, and thus, would not introduce systematic bias.
Being nulliparous (Robson groups 1 & 2) and previous CS scar (Robson group 5) contributed to 60% of the CS rate. The leading contributors for CS rate in the private were Robson groups 5,1,2,3 whereas in the public 5,1,3,2 on descending order. The utmost medical indications of CS were non-reassuring fetal status (NRFS) and repeat CS for previous CS scars in public and private respectively. Having a CS scar is the likelihood factor that increased the CS rate in private than the public. At private 10% of CS was done for failed induction and maternal request mostly among nulliparous groups. This study suggests that a major number of cesarean sections among private services could also be unnecessary.
It is important that efforts to reduce the overall CS rate should focus on reducing the primary CS, encouraging vaginal birth after CS (VBAC). Policies should be directed at the private sector where CS indication seems not to be driven by medical reasons solely. Qualitative and prospective studies are needed to better understand the reasons for high CS among women with previous CS scars.
Data availability
The datasets analyzed on the current study are available from the corresponding author on reasonable request.
Ethical approval
Ethical approval to conduct the study was obtained from the Department Research and Publication Committee (DRPC), Addis Ababa University, College of Health Sciences, department of obstetrics and gynecology, and permission was obtained from the medical directors of the respective hospitals.
Authors’ contributions
AJ proposed and designed the study and thesis. EMA and YG supervised, advised, and helped in the proposal development and analysis. EMA wrote the manuscript. All authors read and approved the final manuscript
The authors express their gratitude to the respective hospital medical directors for permission of accessing medical charts. The authors also would like to acknowledge data collectors and professionals working in the card archive room in both hospitals.
- Cesarean Delivery: Overview, Preparation, Technique. 2019. https://emedicine.medscape.com/article/263424-overview
- Lyell DJ, Power M, Murtough K, Ness A, Anderson B, et al. Surgical Techniques at Cesarean Delivery: A U.S. Survey. Surg J (NY). 2016; 2: e119–25. PubMed: https://www.ncbi.nlm.nih.gov/pmc/articles/PMC5553495/
- Management protocol on selected obstetrics topics. Federal Democratic Republic of Ethiopia Ministry of Health. https://www.academia.edu/40819328/MANAGEMENT_PROTOCOL_ON_SELECTED_OBSTETRICS_TOPICS_Federal_Democratic_Republic_of_Ethiopia_Ministry_of_Health
- Betrán AP, Ye J, Moller AB, Zhang J, Gülmezoglu AM, et al. The Increasing Trend in Caesarean Section Rates: Global, Regional and National Estimates: 1990-2014. PloS One. 2016; 11: e0148343. https://journals.plos.org/plosone/article?id=10.1371/journal.pone.0148343
- Boatin AA, Schlotheuber A, Betran AP, Moller AB, Barros AJD, et al. Within country inequalities in caesarean section rates: observational study of 72 low and middle income countries. BMJ. 2018; k55. http://www.bmj.com/lookup
- Hanson C, Betrán AP, Opondo C, Mkumbo E, Manzi F, et al. Trends in caesarean section rates between 2007 and 2013 in obstetric risk groups inspired by the Robson classification: results from population-based surveys in a low-resource setting. BJOG. 2019; 126: 690–700. PubMed: https://pubmed.ncbi.nlm.nih.gov/30461161/
- Boerma T, Ronsmans C, Melesse DY, Barros AJD, Barros FC, et al. Global epidemiology of use of and disparities in caesarean sections. The Lancet. 2018; 392: 1341–1348. PubMed: https://pubmed.ncbi.nlm.nih.gov/30322584/
- Harrison MS, Goldenberg RL. Cesarean section in sub-Saharan Africa. Maternal Health, Neonatology and Perinatology. 2016; 2: 6. PubMed: https://pubmed.ncbi.nlm.nih.gov/27398224/
- Chu K, Cortier H, Maldonado F, Mashant T, Ford N, et al. Cesarean section rates and indications in sub-Saharan Africa: a multi-country study from Medecins sans Frontieres. PLoS One. 2012; 7: e44484. PubMed: https://pubmed.ncbi.nlm.nih.gov/22962616/
- Dikete M, Coppieters Y, Trigaux P, Fils JF, Englert Y, et al. Variation of caesarean section rates in Sub-Saharan Africa: A literature review. J Gynecol Res Obstet. 2019; 5: 042-047. https://www.peertechz.com/articles/JGRO-5-171.php
- Ethiopia - Demographic and Health Survey 2016. https://microdata.worldbank.org/index.php/catalog/2886
- Yisma E, Smithers LG, Lynch JW, Mol BW. Cesarean section in Ethiopia: prevalence and sociodemographic characteristics. J Matern Fetal Neonatal Med. 2019; 2: 1130-1135. PubMed: https://pubmed.ncbi.nlm.nih.gov/29103331/
- Fesseha N, Getachew A, Hiluf M, Gebrehiwot Y, Bailey P. A national review of cesarean delivery in Ethiopia. Int J Gynecol Obstetr. 2011; 115: 106–111. https://obgyn.onlinelibrary.wiley.com
- WHO Statement on caesarean section rates. Reproductive Health Matters. 2015; https://www.tandfonline.com/doi/abs
- Almeida MA, Araujo Júnior E, Camano L, Peixoto AB, Martins WP, et al. Impact of cesarean section in a private health service in Brazil: indications and neonatal morbidity and mortality rates. Ceska Gynekol. 2018; 83: 4–10.
- Phadungkiatwattana P, Tongsakul N. Analyzing the impact of private service on the cesarean section rate in public hospital Thailand. Arch Gynecol Obstet. 2011; 284: 1375-1379. PubMed: https://pubmed.ncbi.nlm.nih.gov/21359844/
- Tura AK, Pijpers O, de Man M, Cleveringa M, Koopmans I, et al. Analysis of caesarean sections using Robson 10-group classification system in a university hospital in eastern Ethiopia: a cross-sectional study. BMJ Open. 2018; 8: e020520. PubMed: https://pubmed.ncbi.nlm.nih.gov/29622577/
- Nakamura-Pereira M, do Carmo Leal M, Esteves-Pereira AP, Domingues RMSM, Torres JA, et al. Use of Robson classification to assess cesarean section rate in Brazil: the role of source of payment for childbirth. Reprod Health. 2016; 13(Suppl 3): 128. PubMed: https://pubmed.ncbi.nlm.nih.gov/27766941/
- World Health Organization. Robson Classification: Example of Robson Report Table with Interpretation. WHO/RHR/1722. 2017; www.who.int/reproductivehealth/publications/maternal_perinatal_health/robson-classification/en/
- Vogel JP, Betrán AP, Vindevoghel N, Souza JP, Torloni MR, et al. Use of the Robson classifi cation to assess caesarean section trends in 21 countries: a secondary analysis of two WHO multicountry surveys. Lancet Glob Health. 2015; 3: e260-270. PubMed: https://pubmed.ncbi.nlm.nih.gov/25866355/
- Maskey S, Bajracharya M, Bhandari S. Prevalence of Cesarean Section and Its Indications in A Tertiary Care Hospital. JNMA J Nepal Med Assoc. 2019; 57: 70–73. PubMed: https://pubmed.ncbi.nlm.nih.gov/31477935/
- Chaudhary R, Raut KB, Pradhan K. Prevalence and Indications of Cesarean Section in a Community Hospital of Western Region of Nepal. JNMA J Nepal Med Assoc. 2018; 56: 871–874. PubMed: https://pubmed.ncbi.nlm.nih.gov/31065123/
- Gedefaw G, Demis A, Alemnew B, Wondmieneh A, Getie A, et al. Prevalence, indications, and outcomes of caesarean section deliveries in Ethiopia: a systematic review and meta-analysis. Patient Safety in Surgery. 2020; 14: 11. PubMed: https://pubmed.ncbi.nlm.nih.gov/32292491/
- Wondie AG, Zeleke AA, Yenus H, Tessema GA. Cesarean delivery among women who gave birth in Dessie town hospitals, Northeast Ethiopia. PLoS ONE. 2019; 14: e0216344. PubMed: https://pubmed.ncbi.nlm.nih.gov/31059526/
- Aman H, Negash S, Yusuf L. Cesarean delivery practices in teaching public and non-government/private MCH hospitals, Addis Ababa. Ethiopian J Health Develop. 2014; 28: 22–28. https://www.ajol.info/index.php/ejhd/article/view/115406
- Gebremedhin S. Trend and socio-demographic differentials of Caesarean section rate in Addis Ababa, Ethiopia: analysis based on Ethiopia demographic and health surveys data. Reprod Health. 2014; 11: 14. PubMed: https://pubmed.ncbi.nlm.nih.gov/24563907/
- Tsega F, Mengistie B, Dessie Y, Mengesha MM. Prevalence of Cesarean Section in Urban Health Facilities and Associated Factors in Eastern Ethiopia: Hospital Based Cross Sectional Study. J Pregnancy Child Health. 2015; 2: 1–5. https://www.omicsonline.org/open-access/prevalence-of-cesarean-section-in-urban-health-facilities-and-associated-factors-in-eastern-ethiopia-hospital-based-cross-sectional-study-2376-127X-1000169.php?aid=54258
- Melesse MB, Geremew AB, Abebe SM. High prevalence of caesarean birth among mothers delivered at health facilities in Bahir Dar city, Amhara region, Ethiopia. A comparative study. PLoS ONE. 2020; 15: e0231631. PubMed: https://www.ncbi.nlm.nih.gov/pmc/articles/PMC7162673/
- Alonso BD, da Silva FMB, do Rosário M, et al. Caesarean birth rates in public and privately funded hospitals: a cross-sectional study. Rev Saude Publica. 2017; 51: 101. PubMed: https://pubmed.ncbi.nlm.nih.gov/29166449/
- M N, G A, K A, A K, D O, Ns M, et al. Prevalence and determinants of caesarean section in private and public health facilities in underserved South Asian communities: cross-sectional analysis of data from Bangladesh, India and Nepal. BMJ open. 2014; 4. PubMed: https://pubmed.ncbi.nlm.nih.gov/25550293/
- Eyi EGY, Mollamahmutoglu L. An Analysis of the High Cesarean Section Rates in Turkey by Robson Classification. J Matern Fetal Neonatal Med. 2021; 34: 2682-2692. PubMed: https://pubmed.ncbi.nlm.nih.gov/31570019/
- Einarsdóttir K, Haggar F, Pereira G, Leonard H, Klerk N de, Stanley FJ, et al. Role of public and private funding in the rising caesarean section rate: a cohort study. BMJ Open. 2013; 3: e002789. https://bmjopen.bmj.com/content/3/5/e002789
- Elena SV, Marta U, Fern AV, Yazmin LBI, Hazel HRC. The Epidemic of the Cesarean Section in Private Hospital in Puebla, México. 2015.
- Vieira GO, Fernandes LG, de Oliveira NF, Silva LR, Vieira T de O. Factors associated with cesarean delivery in public and private hospitals in a city of northeastern Brazil: a cross-sectional study. BMC Pregnancy Childbirth. 2015; 15: 132. PubMed: https://pubmed.ncbi.nlm.nih.gov/26043857/
- Kazmi T, Sarva Saiseema V, Khan S. Analysis of Cesarean Section Rate - According to Robson’s 10-group Classification. Oman Med J. 2012; 27: 415–417. PubMed: https://www.ncbi.nlm.nih.gov/pmc/articles/PMC3472574/
- Tognon F. Analysis of caesarean section and neonatal outcome using the Robson classification in a rural district hospital in Tanzania: an observational retrospective study. MJ Open. 2019; 9: e033348.
- Zimmo MW, Laine K, Hassan S, Bottcher B, Fosse E, et al. Caesarean section in Palestine using the Robson Ten Group Classification System: a population-based birth cohort study. BMJ Open. 2018; 8: e022875. PubMed: https://pubmed.ncbi.nlm.nih.gov/30361403/
- Naidoo N, Moodley J. Rising rates of Caesarean sections: an audit of Caesarean sections in a specialist private practice. South African Family Practice. 2009; 51. https://www.ajol.info/index.php/safp/article/view/44790
- Betrán AP, Temmerman M, Kingdon C, Mohiddin A, Opiyo N, et al. Interventions to reduce unnecessary caesarean sections in healthy women and babies. The Lancet. 2018; 392: 1358–1368. https://linkinghub.elsevier.com/retrieve/pii/S0140673618319275
- Safe Prevention of the Primary Cesarean Delivery. 2020. https://www.acog.org/en/Clinical/Clinical Guidance/Obstetric Care Consensus/Articles/2014/03/
- Rossi AC, D’Addario V. Maternal morbidity following a trial of labor after cesarean section vs elective repeat cesarean delivery: a systematic review with metaanalysis. Am J Obstet Gynecol. 2008; 199: 224–231. PubMed: https://pubmed.ncbi.nlm.nih.gov/18511018/
- Buchmann EJ. Trial of labour after previous caesarean section in sub-Saharan Africa. BJOG. 2016; 123: 2156.
- Kietpeerakool C, Lumbiganon P, Laopaiboon M, Rattanakanokchai S, Vogel JP, et al. Pregnancy outcomes of women with previous caesarean sections: Secondary analysis of World Health Organization Multicountry Survey on Maternal and Newborn Health. Sci Rep. 2019; 9. PubMed: https://www.ncbi.nlm.nih.gov/pmc/articles/PMC6611838/
- Rudey EL, do Carmo Leal M, Rego G. Cesarean section rates in Brazil Trend analysis using the Robson classification system. 2020; 99: 17: e19880. PubMed: https://pubmed.ncbi.nlm.nih.gov/32332659/
- Tapia V, Betran AP, Gonzales GF. Caesarean Section in Peru: Analysis of Trends Using the Robson Classification System. PLoS One. 2016; 11: e0148138. PubMed: https://pubmed.ncbi.nlm.nih.gov/26840693/
- Barčaitė E, Kemeklienė G, Railaitė DR, Bartusevičius A, Maleckienė L, et al. Cesarean Section Rates in Lithuania Using Robson Ten Group Classification System. Medicina (Kaunas). 2015; 51: 280–285.
- Tsegaye H, Desalegne B, Wassihun B, Bante A, Fikadu K, et al. Prevalence and associated factors of caesarean section in Addis Ababa hospitals, Ethiopia. Pan African Med J. 2019; 34. https://www.panafrican-med-journal.com/content/article/34/136/full/
- Hanvoravongchai P, Letiendumrong J, Teerawattananon Y, Tangcharoensathien V. Implications of Private Practice in Public Hospitals on the Cesarean Section Rate in Thailand. 2020; 11.
- Alonso BD, Silva FMB da, Latorre M do RD de O, Diniz CSG, Bick D. Caesarean birth rates in public and privately funded hospitals: a cross-sectional study. Rev Saude Publica. 2017; 51: 101. PubMed: https://pubmed.ncbi.nlm.nih.gov/29166449/